7.4. Mechanical Properties from Stress-Strain Curves#
# imports
import numpy as np
import pandas as pd
import matplotlib.pyplot as plt
from scipy.stats import linregress
%matplotlib inline
%ls
ABS_HIPS_plot_with_error_bars.png
Al60601_raw_data.xls
Steel1018_raw_data.xls
bar_plot_with_error_bars.ipynb
calculate-yield-strength-programmatically.ipynb
images/
mechanical-properties-from-stress-strain-curves.ipynb
mechanical-properties-intro.md
plotting-stress-strain-curves.ipynb
stress-strain_curve.png
stress_strain_curve_with_inset.png
stress_strain_curve_with_inset_elastic_region.ipynb
df_al = pd.read_excel('Al60601_raw_data.xls')
df_al.head()
WARNING *** OLE2 inconsistency: SSCS size is 0 but SSAT size is non-zero
| TESTNUM | POINTNUM | TIME | POSIT | FORCE | EXT | CH5 | CH6 | CH7 | CH8 | |
|---|---|---|---|---|---|---|---|---|---|---|
| 0 | 542 | 1 | 8.470 | 0.02256 | 201.146011 | -0.001444 | 0.007552 | NaN | NaN | NaN |
| 1 | 542 | 2 | 8.632 | 0.02330 | 206.599442 | 0.000302 | 0.007552 | NaN | NaN | NaN |
| 2 | 542 | 3 | 10.027 | 0.02846 | 287.512573 | 0.003044 | 0.018898 | NaN | NaN | NaN |
| 3 | 542 | 4 | 11.031 | 0.03232 | 365.380981 | 0.009881 | 0.022061 | NaN | NaN | NaN |
| 4 | 542 | 5 | 11.928 | 0.03616 | 447.813965 | 0.014085 | 0.033652 | NaN | NaN | NaN |
df_steel = pd.read_excel('Steel1018_raw_data.xls')
df_steel.head()
WARNING *** OLE2 inconsistency: SSCS size is 0 but SSAT size is non-zero
| TESTNUM | POINTNUM | TIME | POSIT | FORCE | EXT | CH5 | CH6 | CH7 | CH8 | |
|---|---|---|---|---|---|---|---|---|---|---|
| 0 | 523 | 1 | 6.189 | 0.07302 | 202.924728 | 0.000402 | -0.028272 | NaN | NaN | NaN |
| 1 | 523 | 2 | 6.549 | 0.07396 | 205.714890 | -0.000238 | -0.034549 | NaN | NaN | NaN |
| 2 | 523 | 3 | 7.148 | 0.07624 | 217.763336 | -0.000713 | -0.030140 | NaN | NaN | NaN |
| 3 | 523 | 4 | 9.146 | 0.08438 | 316.306122 | 0.002377 | -0.025968 | NaN | NaN | NaN |
| 4 | 523 | 5 | 10.041 | 0.08822 | 417.003357 | 0.003089 | -0.024100 | NaN | NaN | NaN |
d = 0.506
r = d/2
A = np.pi*r**2

stress_al = (df_al['FORCE']/A)*0.001
strain_al = df_al['CH5']*0.01

stress_steel = (df_steel['FORCE']/A)*0.001
strain_steel = df_steel['CH5']*0.01
Plot the full stress strain curve#
fig,ax = plt.subplots()
ax.plot(strain_al, stress_al)
ax.plot(strain_steel, stress_steel)
ax.set_xlabel('Strain (in/in)')
ax.set_ylabel('Stress (ksi)')
ax.set_title('Stress-Strain Curve of Al6061 and Steel1018 in Tension')
ax.legend(['Al6061','Steel1018'])

plt.show()
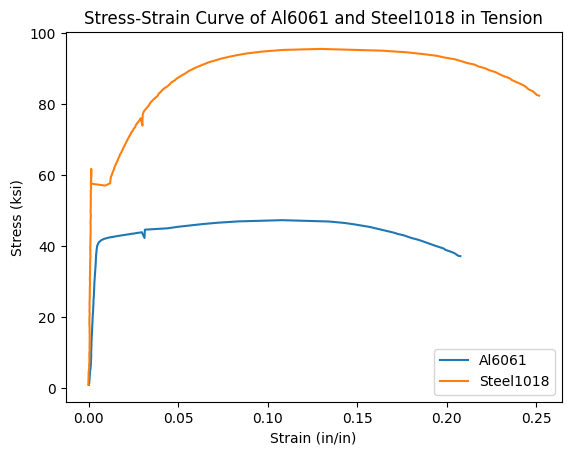
Calculate tensile strength#
# Calculate the tensile strength
ts_al = np.max(stress_al)
ts_steel = np.max(stress_steel)
print(f'The tensile strength of Al6061 is: {round(ts_al,1)} ksi')
print(f'The tensile strength of Steel1018 is: {round(ts_steel,1)} ksi')
The tensile strength of Al6061 is: 47.3 ksi
The tensile strength of Steel1018 is: 95.5 ksi
Caclulate elastic modulus#
fig,ax = plt.subplots()
ax.plot(strain_al, stress_al)
ax.plot(strain_steel, stress_steel)

ax.set_title('Inset of elastic region')
ax.set_xlabel('Strain (in/in)')
ax.set_ylabel('Stress (ksi)')
ax.legend(['Al6061','Steel1018'])

ax.set_xlim([0,0.01])
ax.set_ylim([0,70])

plt.show()
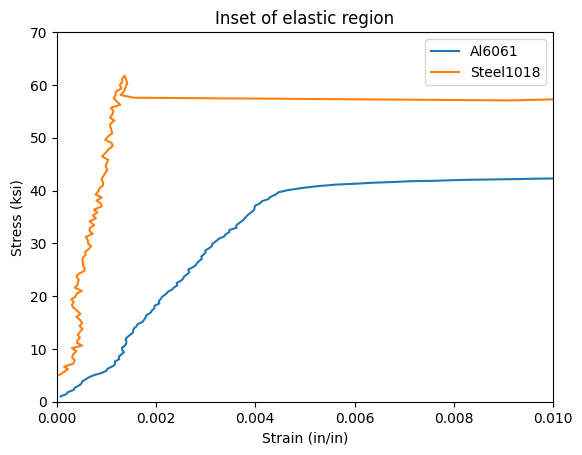
# Find the elastic modulus of Al6061
# use stress and strain values from stress=0 to stress=35 ksi
linear_stress_al_mask = stress_al < 35
linear_stress_al = stress_al[linear_stress_al_mask]
linear_strain_al = strain_al[linear_stress_al_mask]

linear_regression_output = linregress(linear_strain_al, linear_stress_al)
E_al = linear_regression_output[0]

print(f'The elastic modulus of Al6061 is {round(E_al,1)} ksi')
The elastic modulus of Al6061 is 9909.4 ksi
# Find the elastic modulus of Steel1018
# use stress and strain values from stress=0 to stress=55 ksi
linear_stress_steel_mask = stress_steel < 55
linear_stress_steel = stress_steel[linear_stress_steel_mask]
linear_strain_steel = strain_steel[linear_stress_steel_mask]

linear_regression_output_steel = linregress(linear_strain_steel, linear_stress_steel)
E_steel = linear_regression_output_steel[0]

print(f'The elastic modulus of Steel1018 is {round(E_steel,1)} ksi')
The elastic modulus of Steel1018 is 40125.4 ksi
Calculate ductility#
The ductility of a metal is calculated from a stress strain curve by drawing a line down from the fracture point on the curve, parallel to the linear elastic region. Where that line crosses the strain axis is the ductility.
Point-Slope Formula for a line:
Where \(m=\) slope in the linear elastic region (elastic modulus), \(x_1=\) last strain point on the stress strain curve, \(y_1 =\) last stress point on the stress strain curve.
Solve the equation above for \(x\), when \(y=0\) in terms of \(x_1\), \(x_2\) and \(m\).
Substitue in ductility, elastic modulus \(E\), and the last stress and strain points.
# Find the ductility for Al6061
stress_al_array = np.array(stress_al)
stress_al_last = stress_al_array[-1]
strain_al_array = np.array(strain_al)
strain_al_last = strain_al_array[-1]
EL_al = -stress_al_last/E_al + strain_al_last
print(f'The ductility of Al6061 is {round(EL_al*100,1)}%')
The ductility of Al6061 is 20.4%
# Find the ductility of Steel1018
stress_steel_array = np.array(stress_steel)
stress_steel_last = stress_steel_array[-1]
strain_steel_array = np.array(strain_steel)
strain_steel_last = strain_steel_array[-1]
EL_steel = -stress_steel_last/E_steel + strain_steel_last
print(f'The ductility of Steel1018 is {round(EL_steel*100,1)}%')
The ductility of Steel1018 is 25.0%
Cacluate Yield Strength#
The yield strength of a metal is calculated from a stress strain curve by drawing a line parallel to the elastic modulus that goes through the point strain=0.002. Where that line crosses the stress strain curve, that amount of stress is the yield strength
Point-Slope Formula for a line:
Where \(m=\) slope in the linear elastic region (elastic modulus, E), \(x_1=0.002\), and \(y_1 = 0\)
Rewrite the equation, where \(y=stress_{offset}\) and the elastic modulus and value of \(x_1\) and \(y_1\) are included.
# calculate the yield strength of Al6061
stress_offset_al = E_al*(strain_al_array-0.002)

fig, ax = plt.subplots()

ax.plot(strain_al,stress_al,strain_al,stress_offset_al)
ax.set_ylim([0,70])
ax.set_xlim([0,0.01])

plt.show()
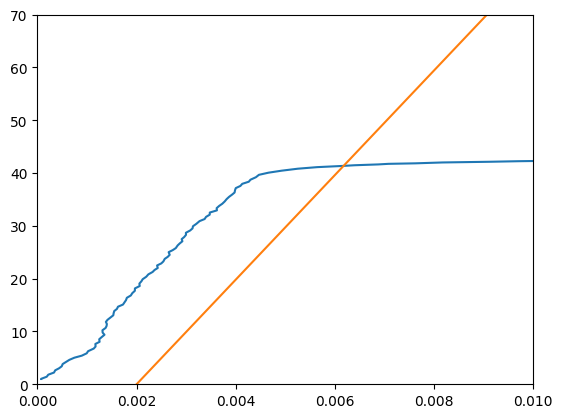
YS_al = 41.3653 # by zooming into the plot that contains the stress strain curve of Al6061 and the offset stress
print(f'The yield strength of Al6061 is {round(YS_al,1)} ksi')
The yield strength of Al6061 is 41.4 ksi
# Calculate the yield strength of Steel1018
stress_offset_steel = E_steel*(strain_steel_array-0.002)

fig, ax = plt.subplots()

ax.plot(strain_steel,stress_steel,strain_steel,stress_offset_steel)
ax.set_ylim([0,70])
ax.set_xlim([0,0.01])

plt.show()
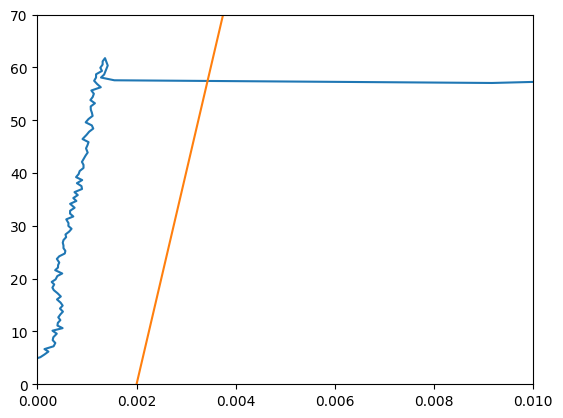
YS_steel = 57.4495 # by zooming into a plot showing the stress strain curve of steel1018 and the offset stress
print(f'the yield strength of steel1018 is {round(YS_steel,1)} ksi')
the yield strength of steel1018 is 57.4 ksi